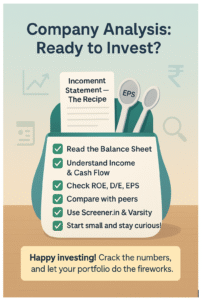
Don’t worry, analyzing a company isn’t rocket science—it’s like checking the health of a business before betting your money on it! By using fundamental analysis, you can dig into a company’s financials to see if it’s a superstar or a dud. In this blog, we’ll break down how to read a balance sheet, income statement, cash flow, and key ratios like ROE, Debt-to-Equity, and EPS, with a fun example using Reliance Industries. With a sprinkle of humor and interactive challenges, let’s make company analysis as exciting as binge-watching your favorite show!

Fundamental analysis is like giving a company a full-body checkup to see if it’s worth your investment. Instead of guessing based on stock price wiggles, you dive into its financial reports to understand its strength, profitability, and growth potential.
- Why It Matters: It helps you pick solid companies that’ll grow your money over time, not just ride market hype.
- Key Tools: Three financial statements (balance sheet, income statement, cash flow) and ratios like ROE, Debt-to-Equity, and EPS.
- Where to Start: Companies like Reliance or TCS publish these reports on their websites or platforms like BSE/NSE.

LOL Moment: Analyzing a company is like swiping right on a stock—check its “profile” before committing!


Trader’s LOL Moment: A balance sheet with too much debt is like a friend who borrows money but always “forgets” to pay back!
The income statement (or profit & loss statement) is like a company’s report card, showing how much money it made (or lost) over a period (usually a year).
- Key Parts:
- Revenue: Total sales or income. For Reliance, think Jio subscriptions + oil sales.
- Expenses: Costs like salaries, raw materials, or marketing.
- Net Profit: Revenue – Expenses. The bottom line—did the company make bank or tank?
- What to Look For:
- Growing revenue year-on-year = business is thriving.
- Controlled expenses = efficient management.
- Consistent or rising net profit = a winner.
Example: TCS’s income statement might show steady revenue from IT services and high profits due to low operational costs.
Quick Challenge: Find TCS’s latest income statement on Moneycontrol.com. What’s their net profit? Share it! #ProfitPro


LOL Moment: Negative cash flow is like your friend who’s always “broke” despite a fancy job—where’s the money going?!


Financial ratios are like a company’s blood test results—they reveal its health in a snap. Here are three beginner-friendly ratios:
- Return on Equity (ROE):
- What Is It?: Measures how well a company uses shareholders’ money. ROE = Net Profit ÷ Equity.
- Why It Matters: Higher ROE (e.g., 15%+) means efficient profit-making. TCS often has high ROE due to strong IT margins.
- Watch Out: Too high ROE (e.g., >30%) might mean risky debt or accounting tricks.
- Debt-to-Equity Ratio:
- What Is It?: Compares debt to equity. D/E = Total Debt ÷ Equity.
- Why It Matters: Low D/E (e.g., <1) = less risky. Reliance’s D/E might be higher due to Jio’s loans but manageable if profits are strong.
- Watch Out: High D/E (e.g., >2) = debt overload.
- Earnings Per Share (EPS):
- What Is It?: Profit per share. EPS = Net Profit ÷ Number of Shares.
- Why It Matters: Growing EPS = more profits for shareholders. TCS’s EPS often grows steadily due to consistent earnings.
- Watch Out: Falling EPS = red flag for profitability.
LOL Moment: A bad ratio is like a Tinder bio with red flags—you swipe left and run!


No need to dig through dusty files—modern tools make analysis a breeze. Here’s how to start:
- Screener.in: Free platform to check balance sheets, income statements, cash flows, and ratios for Indian companies like Reliance or TCS.
- Moneycontrol.com: Offers financials, news, and ratios in a beginner-friendly format.
- Zerodha Varsity: Free lessons on fundamental analysis. Check their “Stock Investing” module.
- Tijori Finance: Great for visualizing cash flows and comparing companies.
- Company Websites: Reliance and TCS post annual reports on their investor pages.
How to Start:
- Pick a company (e.g., Reliance or TCS) on Screener.in.
- Check one financial statement (e.g., balance sheet) and one ratio (e.g., ROE).
- Compare with competitors (e.g., TCS vs. Infosys).
- Read news on Moneycontrol to understand market trends.
- Start small—invest only what you’re comfortable losing.

LOL Moment: Digging into financials feels like being a detective, but instead of a magnifying glass, you’re wielding a calculator!


- Start Simple: Focus on one statement (e.g., income statement) and one ratio (e.g., EPS) to avoid overwhelm.
- Compare Peers: Check TCS vs. Infosys or Reliance vs. Adani to spot the stronger player.
- Look Beyond Numbers: Read news about management, industry trends, or new projects (e.g., Reliance’s green energy push).
- Invest Long-Term: Fundamental analysis shines for 3-5 year bets, not day trading.
- Stay Patient: Analyzing takes time, like waiting for the perfect biryani to cook.

- Learn More: Zerodha Varsity and Moneycontrol’s blogs are goldmines for beginners.